Christmas Travel Survey 2022 – Nearly 43% to Travel; 41% Say Inflation is Affecting Travel Plans; 33% to Spend $501+ on Travel; Gift Exchange Most Hated Tradition

Update: See our 2023 Christmas Travel Survey for updated Christmas data.
Christmas is less than a month away. Our Thanksgiving survey revealed that 112 million American adults would travel for Thanksgiving. Many of these same Americans will now seek to travel for one of the December holidays such as Christmas, Hanukkah, or Kwanzaa. Others who were not out and about for Thanksgiving will soon travel for the first time for the holiday season.
Our goal with this 2022 Christmas survey was to understand how many people intended to travel for the holiday. Which holiday do people prefer to travel for? How much do Americans plan to spend for one of the December holidays? Are high levels of inflation affecting their plans? And, for fun, we threw in a question regarding disliked holiday traditions. Please find the results of our survey below.
Table of Contents
Do you plan on traveling to a vacation destination or holiday gathering (by car, bus, train, airplane, etc.) during the holidays this year?

Let’s take a look at the survey results:
- Christmas/Hanukkah/Kwanzaa. — 18.15%
- Thanksgiving. — 18.54%
- Both. — 24.83%
- No. — 38.48%
Interesting Demographic Comparison — The youngest American adults are most likely to travel for a December holiday this year. 25.93% of people between the ages of 18 and 29 said they plan to travel for Christmas/Hanukkah/Kwanzaa. As respondents’ age increased, they were less and less likely to say they plan to travel. Only 18.73% of Americans between 30 and 44 plan to do so. And, only 16.95% of Americans between 45 and 60 plan to do so. Lastly, only 11.30% of Americans over the age of 60 plan to travel for Christmas/Hanukkah/Kwanzaa this year.
Key Takeaway — Nearly 43% of American adults plan to travel for a December holiday such as Christmas, Hanukkah, or Kwanzaa this year. The 42.98% that said this equates to nearly 111 million people based on the most recent census. This figure includes those who plan to travel to a vacation destination or a gathering for the holiday. The number of people who stated they intend to travel for Christmas/Hanukkah/Kwanzaa is nearly identical to the 112 million American adults that said they intended to travel for Thanksgiving. The 24.83% that said they intended to travel for both works out to 64 million people.
Further Reading: Best & Worst Days to Fly for Christmas
See Also: When to Book Thanksgiving Flights and When to Book Christmas Flights.
The Vacationer Tip
If you are thinking about traveling for Christmas, review the following guides before planning your travel:

Let’s take a look at the survey results:
- Thanksgiving. — 29.21%
- Christmas/Hanukkah/Kwanzaa. — 33.90%
- I prefer not to travel for either. — 36.89%
Interesting Demographic Comparison — Women are significantly more likely to say they prefer not to travel for either Thanksgiving or Christmas. 42.97% of women said this. However, only 30.37% of men said they prefer not to travel for either. 33.88% of men prefer to travel for Thanksgiving. And, 35.74% of men prefer to travel for Christmas/Hanukkah/Kwanzaa. On the other hand, 24.86% of women prefer to travel for Thanksgiving. And, 32.18% of women prefer to travel for Christmas/Hanukkah/Kwanzaa.
Key Takeaway — One out of every three American adults say they prefer to travel for Christmas over Thanksgiving. The 33.90% that said they prefer to travel for Christmas/Hanukkah/Kwanzaa is 16.06% more than the 29.21% that prefer to travel for Thanksgiving. A plurality of American adults says they prefer not to travel for either holiday. The 36.89% that say they prefer not to travel for either holiday represents more than 95 million people.
How much will you spend to travel for Christmas/Hanukkah/Kwanzaa this year? (gas, flights, hotels, tickets, etc.)

- $0. — 41.77%
- $500 or Less. — 25.62%
- $501 to $1,000. — 12.36%
- $1,001 to $1,500. — 8.57%
- $1,501 to $2,000. — 7.78%
- $2,000 or More. — 3.89%
Interesting Demographic Comparison — American adults over the age of 60 are the least likely age group to spend significant money this year for Christmas/Hanukkah/Kwanzaa travel. Only 12.43% of people in this age group said they will spend over $500. On the other hand, 34.39% in the 18-29 age bracket say they will. And, 38.16% in the 30-44 age bracket will. Lastly, 37.29% of American adults in the 45-60 age bracket say they will spend over $500 for Christmas/Hanukkah/Kwanzaa travel
Key Takeaway — Nearly 33% of American adults say they will spend over $500 for Christmas/Hanukkah/Kwanzaa. The 32.6% of people that said they will spend over $500 includes the 12.36% that will spend between $501 and $1,000, the 8.57% that will spend between $1,001 and 1,500, the 7.78% that will spend between $1,501 and $2,000, and the 3.89% that will spend over $2,000. The 32.6% figure also represents over 84 million people. 14% more people said they will spend over $500 for Christmas travel than for Thanksgiving travel.
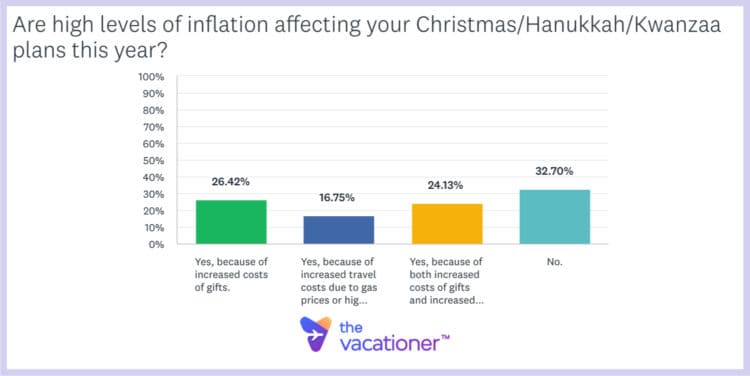
Let’s take a look at the survey results:
- Yes, because of increased costs of gifts. — 26.42%
- Yes, because of increased travel costs due to gas prices or higher airfare. — 16.75%
- Yes, because of both increased costs of gifts and increased travel costs. — 24.13%
- No. — 32.70%
Interesting Demographic Comparison — Men are more likely than women to say that high levels of inflation will affect their Christmas/Hanukkah/Kwanzaa plans this year. 69.21% of men say that high levels of inflation on gifts, gas prices, and airfare will affect their plans. However, only 65.51% of women say that inflation will affect their Christmas/Hanukkah/Kwanzaa plans this year.
Key Takeaway — More than 67% of American adults say high levels of inflation are affecting their Christmas/Hanukkah/Kwanzaa plans this year. The 67.3% that said this represents nearly 174 million people. This is almost the same amount of people that said high levels of inflation are affecting their Thanksgiving plans. Like on Thanksgiving, the high levels of inflation are not stopping Americans from spending altogether. People may save money by buying fewer gifts, traveling to lesser expensive destinations, or asking relatives to stay at their place this holiday season, but American adults will not forego spending altogether.
Which popular holiday traditions do you dislike? (Check All that Apply Except If You Are Checking the Last Choice.)

Here is the full ranked list of most disliked holiday traditions:
1. Gift Exchange. — 26.72%
2. Attending a Religious Service. — 24.93%
3. Caroling or Singing. — 24.23%
4. Holiday Party. — 22.13%
5. Decorating Your Home. — 18.94%
6. Meal with Friends or Family. — 18.54%
7. Lighting Candles. — 13.56%
8. Baking Cookies or Other Sweet Treats. — 12.76%
9. Volunteering. — 11.86%
10. Santa Claus. — 11.47%
11. A Family Tradition. — 11.27%
12. Christmas Trees. — 9.67%
13. Seeing Lights. — 8.57%
None of these. I like them all. — 29.11%
*Note: Survey respondents were able to choose as many items as they wanted.
Interesting Demographic Comparison — American adults from the Middle Atlantic region are significantly more likely to dislike the major holiday traditions than all other regions. The Middle Atlantic region consists of the states of New York, New Jersey, and Pennsylvania. People in this region were most likely to say they disliked a meal with friends or family, a gift exchange, a holiday party, decorating your home, or baking cookies or other sweet treats. On the other hand, the West South Central is the least likely to dislike holiday traditions. The West South Central region includes the states of Arkansas, Louisiana, Oklahoma, and Texas.
Key Takeaway — The top three most disliked holiday traditions are 1) A Gift Exchange, 2) Attending a Religious Service, and 3) Caroling or Singing. Nearly 27% of American adults or 69 million people dislike gift exchanges. Nearly 25% or more than 64 million American adults dislike attending a religious service. Lastly, more than 24%, or over 62 million people dislike caroling or singing. Surprisingly, 29.11% or 75 million people stated they like all of these holiday traditions!
Survey Methodology
This 2022 Christmas Travel Survey was conducted by SurveyMonkey on behalf of The Vacationer. In total, 1,003 Americans over the age of 18 were polled on October 25. Of those surveyed, 48.26% were male and 51.74% were female. The age breakdown of participants included in this survey was 18.84% in the range 18-29, 28.22% in the range 30-44, 35.29% in the range 45-60, and 17.65% over 60. This survey has a confidence level of 95% and a margin of error of ±3.158%. You can learn more about SurveyMonkey’s sampling method by clicking here.
The questions were chosen and the results were analyzed by the post author, Eric Jones, who is a Mathematics and Statistics Professor at Rowan College South Jersey.
Editorial Disclosure: Opinions expressed here are the author’s alone, not those of any bank, credit card issuer, hotel, airline, or other entity. This content has not been reviewed, approved, or otherwise endorsed by any of the entities included within the post.

Get The Vacationer Newsletter
Get highlights of the most important news delivered to your email inbox
See also

Thanksgiving Travel Survey 2022 — 43%+ to Travel; 66%+ Say Inflation is Affecting Plans; 29% to Spend $501+ on Travel; Cranberry Sauce Most Hated Food

Best & Worst Days to Fly & Travel for the Holidays – Thanksgiving, Christmas, & New Year’s 2024