Thanksgiving Travel Survey 2022 — 43%+ to Travel; 66%+ Say Inflation is Affecting Plans; 29% to Spend $501+ on Travel; Cranberry Sauce Most Hated Food

Update: See our 2024 Thanksgiving Travel Survey and our 2023 Holiday Travel Survey for updated Thanksgiving data.
It is now November, and holiday travel will begin in a few weeks. Many Americans will hit the road or hop on a plane over the next two months to see loved ones and friends. And, we hope those flying read our Best and Worst Days to Fly for the Holidays guide before booking. Regardless, we are still interested in their general travel plans for Thanksgiving.
We conducted this Thanksgiving travel survey to see how many people planned to travel for the holidays. Additionally, our goal was to gauge sentiment for the holidays and trends of travel plans. How many people plan on traveling for the holidays? Will more Americans travel for Thanksgiving or Christmas? Which holidays do people prefer to travel for? And, how much will they spend to travel for each holiday? Is inflation a concern for their plans? Lastly, like last year, we threw in a fun question about the most disliked traditional Thanksgiving food. Below you can find the answers to these questions as well as an analysis.
Table of Contents
Do you plan on traveling to a vacation destination or holiday gathering (by car, bus, train, airplane, etc.) during the holidays this year?
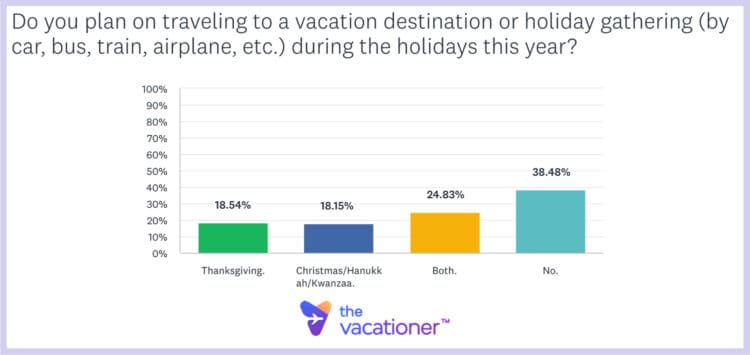
Let’s take a look at the survey results:
- Thanksgiving. — 18.54%
- Christmas/Hanukkah/Kwanzaa. — 18.15%
- Both. — 24.83%
- No. — 38.48%
Interesting Demographic Comparison — Men are more likely than women to travel for Thanksgiving this year. 48.96% of men said they intend to go on vacation or travel to a Thanksgiving gathering this year. On the other hand, only 38.15% of women will. Men are also more likely to have travel plans for one of the December holidays.
Key Takeaway — More than 43% of American adults plan on traveling to a vacation destination or holiday gathering this year. The 43.37% includes the 18.54% of people who intend to only travel for Thanksgiving and the 24.83% of Americans who intend to travel for both Thanksgiving and Christmas. Based on the latest census, the 43.37% represents nearly 112 million American adults traveling for Thanksgiving. This figure is slightly more than the 109 million that stated they intended to travel for Thanksgiving in last year’s survey. Roughly the same number of American adults intend to travel for the December holidays as they do for Thanksgiving.
See Also: When to Book Thanksgiving Flights and When to Book Christmas Flights.
The Vacationer Tip
If you are thinking about traveling for Thanksgiving, review the following guides before planning your travel:
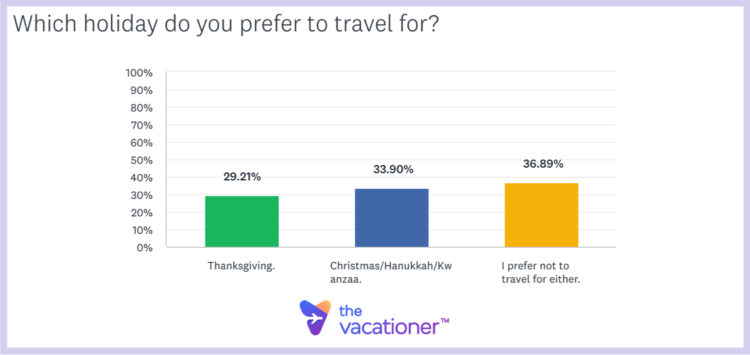
Let’s take a look at the survey results:
- Thanksgiving. — 29.21%
- Christmas/Hanukkah/Kwanzaa. — 33.90%
- I prefer not to travel for either. — 36.89%
Interesting Demographic Comparison — The oldest generation of American adults over age 60 were the least likely to prefer to travel for any holiday. 56.50% of Americans in this age bracket said they prefer not to travel for either. As the age brackets decreased in age, people were more likely to say they wanted to travel for one of the holidays. The most likely age bracket to travel for any holiday is American adults aged 18-29. Only 26.46% of people in this age bracket said they prefer not to travel for either holiday. Interestingly, American adults in the 18-29 age bracket are also the least likely to say they prefer to travel for Thanksgiving. This is due to their overwhelming desire to travel for Christmas.
Key Takeaway — More American adults state they intend to travel for a December holiday such as Christmas than Thanksgiving. 33.90% of people stated they prefer to travel for Christmas/Hanukkah/Kwanzaa. However, only 29.21% stated they prefer to travel for Thanksgiving. This means that nearly 14% fewer people prefer Thanksgiving travel than Christmas. Surprisingly, 36.89% or more than 95 million American adults prefer to not travel for either.
How much will you spend to travel for Thanksgiving this year? (gas, flights, hotels, tickets, etc.)
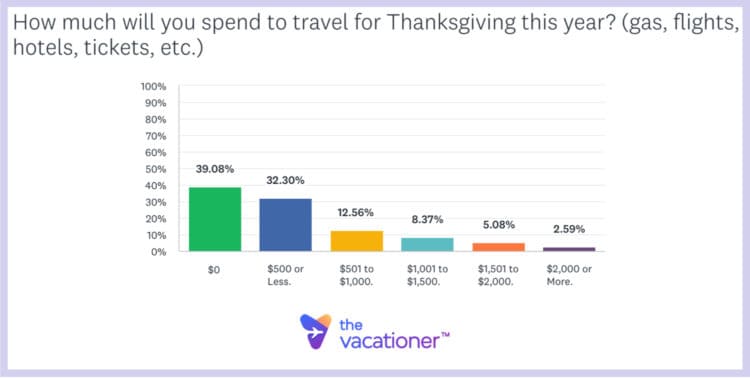
- $0. — 39.08%
- $500 or Less. — 32.30%
- $501 to $1,000. — 12.56%
- $1,001 to $1,500. — 8.37%
- $1,501 to $2,000. — 5.08%
- $2,000 or More. — 2.59%
Interesting Demographic Comparison — Men will spend much more money on Thanksgiving travel this year than women. This should come as no surprise since in question #1 more men stated they intended to travel for Thanksgiving. 33.88% of men say they intend to spend over $500. However, only 23.7% of women say they will. Additionally, 19.83% of men say they intend to spend over $1,000 while only 12.52% of women say they will.
Key Takeaway — Nearly 29% of American adults say they will spend more than $500 to travel for Thanksgiving this year. This figure represents nearly 74 million adults. The 28.6% is made up of the 12.56% that say they will spend between $501 to $1,000, the 8.37% that will spend between $1,001 to $1,500, the 5.08% that will spend between $1,501 to $2,000, and the 2.59% that intend to spend more than $2,000. Last year, only 20.13% of Americans intended to spend more than $500. This means 42% more people this year intend to spend over $500 than last year. Unfortunately, Americans are seeing rising gas prices and expensive flights and understand they are going to have to pay significantly more this year to travel for Thanksgiving.
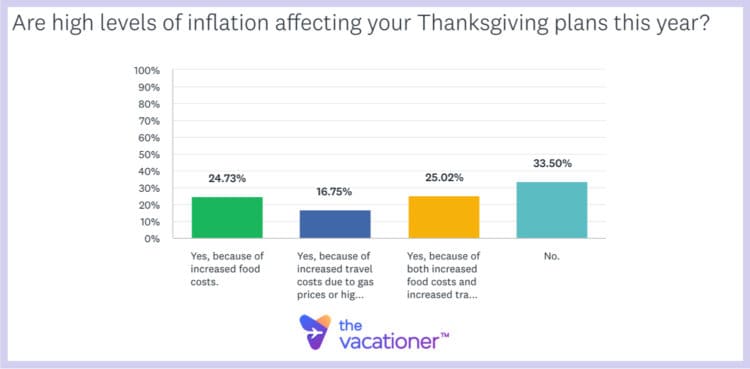
Let’s take a look at the survey results:
- Yes, because of increased food costs. — 24.73%
- Yes, because of increased travel costs due to gas prices or higher airfare. — 16.75%
- Yes, because of both increased food costs and increased travel costs. — 25.02%
- No. — 33.50%
Interesting Demographic Comparison — American adults in the Middle Atlantic region are the most likely to say high levels of inflation are affecting their Thanksgiving plans. The Middle Atlantic region includes the states of New York, New Jersey, and Pennsylvania. 77.45% of people in this region said that high levels of inflation were a concern. On the other hand, people in the New England region are the least likely to say high levels of inflation are affecting their Thanksgiving plans. The New England region includes the states of Maine, New Hampshire, Vermont, Massachusetts, Rhode Island, and Connecticut. Only 53.19% of American adults in this region have inflation concerns about the holiday.
Key Takeaway — Two out of every three American adults say high levels of inflation are affecting their Thanksgiving plans. The 66.5% that said this represents more than 171 million people. The figure includes the 24.73% that say high inflation is affecting their plans because of increased food costs. It also includes the 16.75% that say it is affecting their Thanksgiving plans due to increased gas prices and higher airfare. Lastly, it includes the 25.02% that say both increased food costs and increased travel costs are affecting their plans.
Which of these traditional Thanksgiving foods do you dislike? (Check All that Apply Except If You Are Checking the Last Choice.)
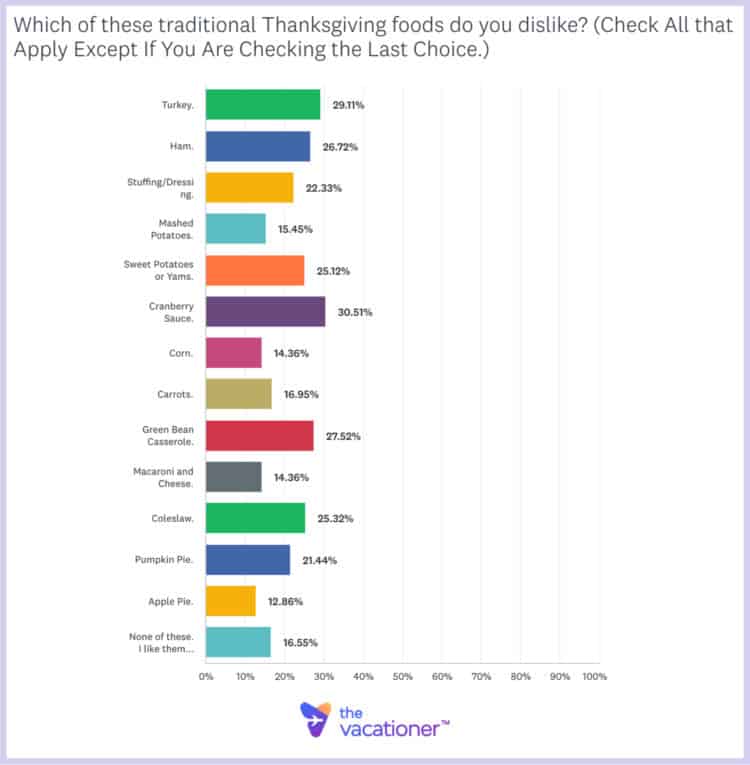
Here is the full ranked list of most disliked traditional Thanksgiving foods:
1. Cranberry Sauce — 30.51%
2. Turkey — 29.11%
3. Green Bean Casserole — 27.52%
4. Ham — 26.72%
5. Coleslaw — 25.32%
6. Sweet Potatoes or Yams — 25.12%
7. Stuffing/Dressing. — 22.33%
8. Pumpkin Pie. — 21.44%
9. Carrots. — 16.95%
10. Mashed Potatoes. — 15.45%
11. Corn. — 14.36%
12. Macaroni and Cheese. — 14.36%
13. Apple Pie. — 12.86%
None of these. I like them all. — 16.55%
*Note: Survey respondents were able to choose as many items as they wanted.
Interesting Demographic Comparison — The Middle Atlantic region far and away has the most people that say they do not like turkey. 47.06% of people in the Middle Atlantic said they do not like turkey. The West North Central region has the least amount of people that dislike turkey. Only 11.32% in this region said they dislike turkey. The West North Central region contains the states of Minnesota, Iowa, Missouri, North Dakota, South Dakota, Nebraska, and Kansas.
Key Takeaway — Nearly 30% of all American adults dislike turkey. Turkey is the prototypical Thanksgiving food and it turns out that three out of every ten people do not even like it. The 29.11% that say they do not like turkey represents 75 million people. This makes turkey the second most disliked Thanksgiving food. The most disliked Thanksgiving food goes to cranberry sauce with 30.51% of American adults saying they could do without it. The third most disliked Thanksgiving food is green bean casserole at 27.52%. This is the second year in a row that cranberry sauce, turkey, and green bean casserole topped the list of most disliked Thanksgiving foods in our survey.
Survey Methodology
This 2022 Thanksgiving Travel Survey was conducted by SurveyMonkey on behalf of The Vacationer. In total, 1,003 Americans over the age of 18 were polled on October 25. Of those surveyed, 48.26% were male and 51.74% were female. The age breakdown of participants included in this survey was 18.84% in the range 18-29, 28.22% in the range 30-44, 35.29% in the range 45-60, and 17.65% over 60. This survey has a confidence level of 95% and a margin of error of ±3.158%. You can learn more about SurveyMonkey’s sampling method by clicking here.
The questions were chosen and the results were analyzed by the post author, Eric Jones, who is a Mathematics and Statistics Professor at Rowan College South Jersey.
Editorial Disclosure: Opinions expressed here are the author’s alone, not those of any bank, credit card issuer, hotel, airline, or other entity. This content has not been reviewed, approved, or otherwise endorsed by any of the entities included within the post.

Get The Vacationer Newsletter
Get highlights of the most important news delivered to your email inbox
See also

Christmas Travel Survey 2022 – Nearly 43% to Travel; 41% Say Inflation is Affecting Travel Plans; 33% to Spend $501+ on Travel; Gift Exchange Most Hated Tradition

Best & Worst Days to Fly & Travel for the Holidays – Christmas & New Year’s 2025