Thanksgiving Travel Survey 2021 — Mode of Transportation, Spending, Dinner Location, How Many at Dinner, Most Disliked Food

2024 Update – Our Thanksgiving Travel Survey for 2024 is now available. You can also see our Christmas Travel Survey for 2022.
Our 2021 Holiday Travel Survey revealed that nearly 63% of American adults or 161 million people will travel for at least one holiday this year. The survey indicated that 109 million American adults (over 42%) will travel for Thanksgiving. This includes 15.19% or 39 million people who will travel for Thanksgiving only. Additionally, it includes the 27.17% or 70 million that will travel for both Thanksgiving and Christmas, Hanukkah, or Kwanzaa. See our 2021 Christmas Travel Survey.
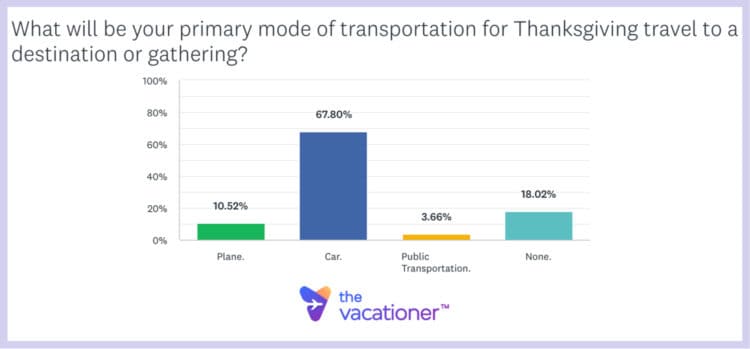
With so many people planning to travel for Thanksgiving, we conducted this travel survey to gauge travel sentiment and plans for the holiday. What will be the primary mode of transportation for Thanksgiving travel? How much will people spend to travel this year? Where will most people eat Thanksgiving dinner? How large will gatherings be? Which traditional Thanksgiving foods do people dislike most? Below are the answers to these questions and more.
Let’s take a look at the survey results:
- Plane. — 10.52%
- Car. — 67.80%
- Public Transportation. — 3.66%
- None. — 18.02%
The Vacationer Tip
Don’t forget to leverage your credit card to save money when you travel. If you do not have a travel-rewards credit card, our highest recommendations are the Chase Sapphire Preferred® Card, the Capital One Venture X Rewards Credit Card, and the Citi Premier® Card. If you would like to see other offers, Click to See All of Our Recommended Travel Credit Cards.
Interesting Demographic Comparison — The youngest American adults aged 18-29 are most likely to travel for Thanksgiving via plane this year. 13.92% of those aged 18-29 said this. On the other hand, those aged 60 or older are least likely to travel on a plane. Only 6.20% of American adults over 60 will fly on a plane for Thanksgiving. Lastly, those aged 18-29 are also most likely to use public transportation to travel for Thanksgiving. 10.62% of American adults 18-29 said they’d be using public transportation.
Key Takeaway — More than one out of every ten American adults will fly on a plane to their Thanksgiving gathering or vacation. The 10.52% figure equates to more than 27 million people according to the latest census. Last year the TSA reported that 9.5 million passengers flew over the Thanksgiving holiday travel period. This means that passengers for Thanksgiving travel this year should be nearly three times more than in 2020.
Further Reading: Check out our Best & Worst Days to Fly for Thanksgiving guide.
See Also: When to Book Thanksgiving Flights and When to Book Christmas Flights.
How much will you spend to travel for Thanksgiving this year? (gas, flights, hotels, tickets, etc.)
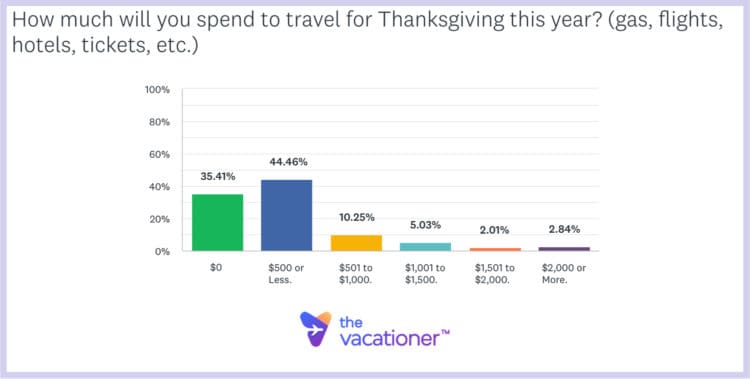
- $0. — 35.41%
- $500 or Less. — 44.46%
- $501 to $1,000. — 10.25%
- $1,001 to $1,500. — 5.03%
- $1,501 to $2,000. — 2.01%
- $2,000 or More. — 2.84%
Interesting Demographic Comparison — Men will spend significantly more money than women for Thanksgiving travel this year. 24.23% of men will spend over $500. However, only 16.33% of women will spend over $500. Similarly, 11.44% of men will spend over $1,000 for Thanksgiving travel while only 8.34% of women will.
Key Takeaway — More than 20% of American Adults will spend at least $500 on Thanksgiving travel. This includes costs for gas, flights, hotels, tickets, etc. The figure includes the 10.25% of people who intend to spend $501 to $1,000 and the 5.03% that intend to spend between $1,001 to $1,500. Also, it includes the 2.01% that will spend between $1,501 and $2,000. Lastly, it includes the 2.84% that will spend more than $2,000. Overall, the 20.13% represents about 52 million people. The nearly 10% that will spend over $1,000 represents more than 25 million people.
Let’s take a look at the survey results:
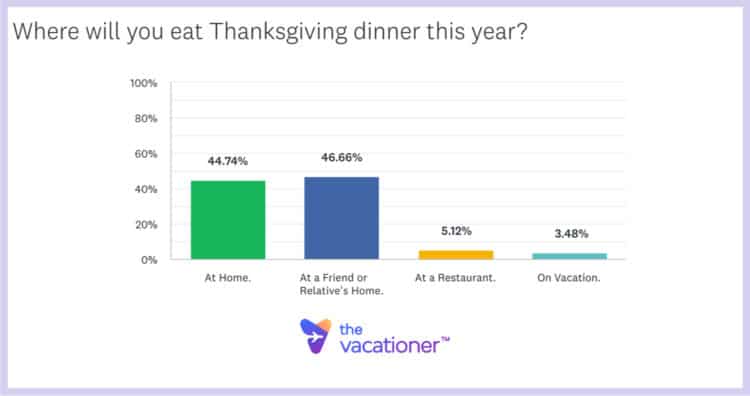
- Home. — 44.74%
- Friend or Relative’s Home. — 46.66%
- Restaurant. — 5.12%
- On Vacation. — 3.48%
Interesting Demographic Comparison — Individuals over 60 are most likely to eat Thanksgiving dinner at home this year. 50% of American adults over 60 will eat at home. As respondents decreased in age, they were less likely to eat Thanksgiving dinner at home. 46.29% of Americans between 45-60 will eat at home. 42.50% of those aged 30-44 will eat at home. Lastly, only 39.93% of Americans aged 18-29 will eat at home.
Key Takeaway — Over 91% of all American adults will eat Thanksgiving dinner at home or a friend or relative’s home. This equates to more than 235 million people. 5.12% or about 13 million people will eat out at a restaurant. And, 3.48% or 9 million people will have their Thanksgiving dinner on vacation.
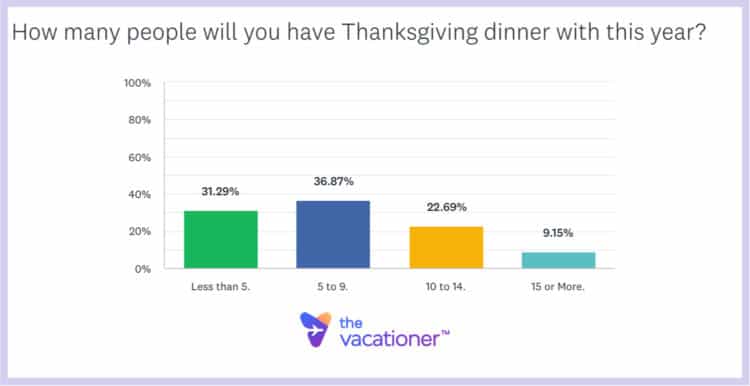
How many people will you have Thanksgiving dinner with this year?
Let’s take a look at the survey results:
- Less than 5. — 31.29%
- 5 to 9. — 36.87%
- 10 to 14. — 22.69%
- 15 or More. — 9.15%
Interesting Demographic Comparison — Americans in the West North Central region are most likely to attend a large Thanksgiving gathering of 10 or more people. This region contains the states of Minnesota, Iowa, Missouri, North Dakota, South Dakota, Nebraska, and Kansas. 43.37% of people in this region said they would attend a Thanksgiving gathering of 10 or more. On the other hand, those in the Pacific region are least likely to attend a large Thanksgiving gathering this year. Only 26.1% of people in this region said they would. The Pacific region contains the states of Washington, Oregon, California, Alaska, and Hawaii.
Key Takeaway — Nearly 32% of all American adults will attend a large Thanksgiving gathering of 10 or more people this year. This figure equates to 82 million people. Additionally, more than 9% of all American adults will attend an even larger Thanksgiving gathering of 15 or more. This figure equates to nearly 24 million people. Despite lingering COVID-19 concerns, many Americans are going back to more traditional Thanksgiving gatherings.
Which traditional Thanksgiving food do you dislike most?
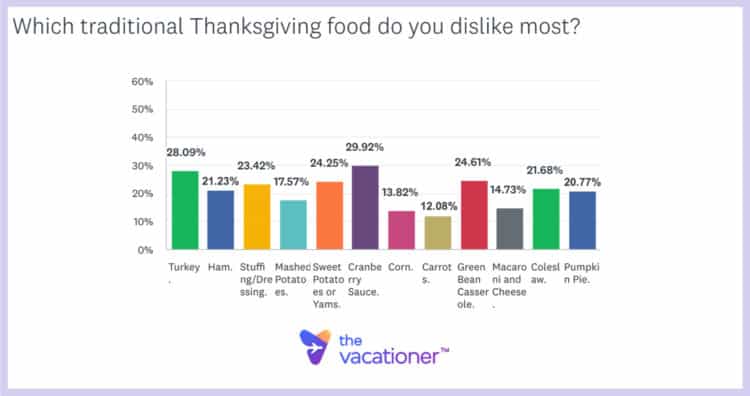
Let’s take a look at the survey results:
- Turkey. — 28.09%
- Ham. — 21.23%
- Stuffing/Dressing. — 23.42%
- Mashed Potatoes. — 17.57%
- Sweet Potatoes or Yams. — 24.25%
- Cranberry Sauce. — 29.92%
- Corn. — 13.82%
- Carrots. — 12.08%
- Green Bean Casserole. — 24.61%
- Macaroni and Cheese. — 14.73%
- Coleslaw. — 21.68%
- Pumpkin Pie. — 20.77%
*Note: Survey respondents were able to choose as many items as they wanted.
Interesting Demographic Comparison — American adults aged 18-29 are twice as likely to dislike turkey than Americans over 60. 38.46% of those aged 18-29 said they disliked Thanksgiving turkey. However, only 16.94% of Americans over 60 stated they dislike turkey. Interestingly, 27.11% of Americans aged 18-29 said they disliked mashed potatoes. This is nearly three times the 9.50% of Americans over age 60 who say they dislike mashed potatoes. The data suggests that younger Americans are overwhelmingly pickier eaters than older people.
Key Takeaway — Nearly 30% of all American adults stated they disliked Thanksgiving turkey. The 28.09% figure equates to more than 72 million people. Additionally, nearly 30% stated they disliked cranberry sauce. The 29.92% for cranberry sauce makes cranberry sauce the most disliked Thanksgiving food. The 28.09% makes turkey the second most disliked food. And, the 24.61% makes green bean casserole the third most disliked traditional Thanksgiving food item. Surprisingly, 20.77% or more than 53 million people stated they dislike pumpkin pie!
Survey Methodology
This Thanksgiving Travel 2021 Survey was conducted by SurveyMonkey on behalf of The Vacationer. In total, 1,092 Americans over the age of 18 were polled on October 17. Of those surveyed, 47.25% were male and 52.75% were female. The age breakdown of participants included in this survey was 25.00% in the range 18-29, 21.98% in the range 30-44, 30.86% in the range 45-60, and 22.16% over 60. This survey has a confidence level of 95% and a margin of error of ±3.026%. You can learn more about SurveyMonkey’s sampling method by clicking here.
The questions were chosen and the results were analyzed by the post author, Eric Jones, who is a Mathematics and Statistics Professor at Rowan College South Jersey.
Editorial Disclosure: Opinions expressed here are the author’s alone, not those of any bank, credit card issuer, hotel, airline, or other entity. This content has not been reviewed, approved, or otherwise endorsed by any of the entities included within the post.

Get The Vacationer Newsletter
Get highlights of the most important news delivered to your email inbox
See also

Holiday Travel Survey 2021 — How Many to Travel, Comfort Level, Virtual Holidays, Holidays with Unvaccinated or People You Dislike

Best & Worst Days to Fly & Travel for the Holidays – Christmas & New Year’s 2025